Categories
Blog posts about QNAP's products and technologies.
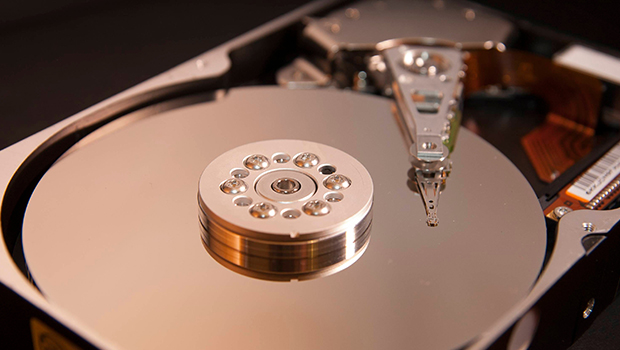
Have you ever opened a local file on your computer system that seemed to take a long time to open? If a file takes too long to open, you might quit the opening application and try to open the file again. And if this happens on a regular basis, you might even consider getting a new computer or new drives. This may happen even if your read IOPS, a common indicator of drive speed, is relatively high.
However, chances are that this kind of frustrating user experience willbe reflected in something called long latency read count. Behind the scenes, whenever your system sends a request to read data from your drive, it keeps track of the amount of time that the drive is taking to return that information to the system. If the read request takes longer than a certain amount of time, the system will increment the long latency read count. For HDDs, the criterion for incrementing long latency read count is typically when a read command takes longer than 1000ms + (the number of sectors being read / 256)*2ms.
Long latency reads on an HDD are usually caused by excess read retries. These excess retries can be due to one of two reasons: bad sectors, and badly written data. Bad sectors, or damaged disk media, can be caused by defects that happen during the manufacturing process, or after the manufacturing process by loose particles or head crashes. Data may be badly written if the write was weak, written off-track, or overwritten by data belonging to an adjacent track, which may be caused by vibration. These two reasons usually cause the drive to retry the read several times, possibly with slightly altered head positions or electrical strength. And because each retry requires the head to make another rotation, the read may require several rotations, and thus a longer time, to succeed.
The Importance of Long Latency Read Data in Drive Health Prediction
Furthermore, during the training of our own machine learning algorithms for ULINK DA Drive Analyzer to predict the remaining useful life of drives, we noticed that long latency read data was given high importance scores by the algorithms. This meant that the algorithms determined that long latency read data was useful in predicting drives’ remaining useful life, especially in conjunction with other predictors.
Due to the likely reflection of a slow user experience on this metric and the relationship between this metric and the lifespan of drives, we thought it might be interesting to compare some drive models by their long latency read data to see which ones fared better or worse.
The Data Collection Process
The data we used to rank drive models was SATA HDD health data collected from NAS users in May of 2023. We used drives that had at least two adjacent days of data within that month. For each drive, read command counts were originally reported as lifetime running totals, so we converted these to daily values by calculating daily differences. Long latency read counts were originally reported as daily values and were kept as such.
Furthermore, we excluded drives with no model info. We excluded drives with non-ASCII model info. We excluded drives that did not report long latency read info or read command count info. We excluded drives that were not issued any read commands. We retained drives that had a power-on year value between 4 and 5 years, because we were interested in ranking drives after they had been used for some time, and because we wanted to control for the possible confound of drive age on rankings.
For each drive, we calculated the ratio of long latency reads to read commands, and excluded drives whose ratios were outliers (i.e., 1.5 IQR above Q3). This was done so that we could compare the typical user experience between drive models. We retained drive models with at least 100 drives. For each drive model, we then calculated the ratio of total long latency reads to total read commands, and then multiplied the resulting figure by 1 million. This ratio, the “long latency read ratio,” was used to rank the drive models. This left us with 120 drive models and 135,501 drives for ranking.
Table 1: Disk Drive Long Latency Read (LLR) Rankings (for 4 year old drives)
| Rank | Mfg | Model Number | Cap(TB) | Drive Count | Avg POY | Total LLR Count | Total Read Cmds (Million) |
LLR Ratio |
| 1 | Seagate | st10000vx0004-1ze101 | 10 | 250 | 4.43 | 329 | 9,215 | 0.04 |
| 2 | Seagate | st10000vn0004-1zd101 | 10 | 2,765 | 4.43 | 4,961 | 85,782 | 0.06 |
| 3 | Seagate | st10000ne0004-1zf101 | 10 | 819 | 4.41 | 2,840 | 19,938 | 0.14 |
| 4 | Seagate | st1000dm010-2ep102 | 1 | 442 | 4.43 | 488 | 2,968 | 0.16 |
| 5 | Seagate | st10000ne0004-2gt11l | 10 | 176 | 4.57 | 725 | 3,868 | 0.19 |
| 6 | WDC | wdc wd2003fzex-00srla0 | 2 | 103 | 4.47 | 255 | 545 | 0.47 |
| 7 | HGST | hgst hus722t2tala604 | 2 | 315 | 4.35 | 1,516 | 2,850 | 0.53 |
| 8 | Seagate | st8000ne0004-1zf11g | 8 | 800 | 4.43 | 8,265 | 14,946 | 0.55 |
| 9 | WDC | wdc wd8003fryz-01jpdb1 | 8 | 661 | 4.59 | 55,795 | 77,148 | 0.72 |
| 10 | HGST | hgst huh721212ale604 | 12 | 192 | 4.36 | 5,498 | 6,107 | 0.90 |
| 11 | HGST | hgst hus726060ale610 | 6 | 271 | 4.48 | 23,297 | 25,868 | 0.90 |
| 12 | WDC | wdc wd1005fbyz-01ycbb2 | 1 | 111 | 4.57 | 1,322 | 1,426 | 0.93 |
| 13 | Seagate | st1000vn002-2ey102 | 1 | 697 | 4.45 | 8,474 | 6,819 | 1.24 |
| 14 | WDC | wdc wd101kryz-01jpdb1 | 10 | 726 | 4.63 | 62,499 | 49,810 | 1.25 |
| 15 | WDC | wdc wd2005fbyz-01ycbb2 | 2 | 478 | 4.65 | 6,653 | 4,762 | 1.40 |
| 16 | Seagate | st8000vx0022-2ej112 | 8 | 382 | 4.52 | 10,208 | 7,189 | 1.42 |
| 17 | Seagate | st4000nm0115-1yz107 | 4 | 262 | 4.45 | 31,351 | 21,756 | 1.44 |
| 18 | Toshiba | toshiba hdwg11a | 10 | 125 | 4.32 | 3,592 | 2,413 | 1.49 |
| 19 | WDC | wdc wd60purz-85zufy1 | 6 | 246 | 4.41 | 10,549 | 6,970 | 1.51 |
| 20 | HGST | hgst huh721010ale600 | 10 | 312 | 4.41 | 12,694 | 7,412 | 1.71 |
| 21 | Seagate | st14000vn0008-2jg101 | 14 | 200 | 4.27 | 7,552 | 4,155 | 1.82 |
| 22 | HGST | hgst hus728t8tale6l4 | 8 | 284 | 4.24 | 14,099 | 7,368 | 1.91 |
| 23 | WDC | wdc wd60efrx-68l0bn1 | 6 | 5,126 | 4.46 | 203,116 | 104,943 | 1.94 |
| 24 | WDC | wdc wd2002ffsx-68pf8n0 | 2 | 1,045 | 4.51 | 17,088 | 8,337 | 2.05 |
| 25 | Seagate | st12000ne0007-2gt116 | 12 | 539 | 4.45 | 28,696 | 13,846 | 2.07 |
| 26 | HGST | hgst huh721010ale604 | 10 | 315 | 4.37 | 26,029 | 11,980 | 2.17 |
| 27 | HGST | hgst hdn721010ale604 | 10 | 294 | 4.64 | 18,727 | 8,435 | 2.22 |
| 28 | WDC | wdc wd40ezrz-00gxcb0 | 4 | 679 | 4.41 | 21,626 | 9,535 | 2.27 |
| 29 | WDC | wdc wd8003ffbx-68b9an0 | 8 | 933 | 4.36 | 72,529 | 30,574 | 2.37 |
| 30 | WDC | wdc wd40purz-85ttdy0 | 4 | 809 | 4.42 | 41,872 | 16,976 | 2.47 |
| 31 | WDC | wdc wd30ezrz-00gxcb0 | 3 | 139 | 4.56 | 6,616 | 2,633 | 2.51 |
| 32 | Seagate | st4000vx000-2ag166 | 4 | 107 | 4.44 | 2,806 | 1,114 | 2.52 |
| 33 | Seagate | st6000vn0041-2el11c | 6 | 1,083 | 4.58 | 56,723 | 21,844 | 2.60 |
| 34 | WDC | wdc wd100emaz-00wjta0 | 10 | 345 | 4.25 | 34,657 | 12,838 | 2.70 |
| 35 | WDC | wdc wd4000f9yz-09n20l1 | 4 | 116 | 4.50 | 5,798 | 2,125 | 2.73 |
| 36 | HGST | hgst hus726t4tala6l4 | 4 | 181 | 4.25 | 8,427 | 3,018 | 2.79 |
| 37 | WDC | wdc wd100efax-68lhpn0 | 10 | 2,217 | 4.42 | 349,450 | 124,124 | 2.82 |
| 38 | HGST | hgst huh721212ale600 | 12 | 265 | 4.35 | 30,883 | 10,927 | 2.83 |
| 39 | WDC | wdc wd4003ffbx-68mu3n0 | 4 | 2,547 | 4.44 | 176,741 | 60,196 | 2.94 |
| 40 | WDC | wdc wd40efrx-68n32n0 | 4 | 23,891 | 4.46 | 1,308,507 | 428,091 | 3.06 |
| 41 | Toshiba | toshiba hdwn180 | 8 | 368 | 4.41 | 36,853 | 11,999 | 3.07 |
| 42 | WDC | wdc wd30efrx-68n32n0 | 3 | 3,617 | 4.50 | 197,416 | 61,405 | 3.22 |
| 43 | Seagate | st4000dm000-1f2168 | 4 | 109 | 4.45 | 4,548 | 1,407 | 3.23 |
| 44 | WDC | wdc wd6002ffwx-68tz4n0 | 6 | 615 | 4.64 | 64,147 | 17,868 | 3.59 |
| 45 | Seagate | st8000ne0021-2en112 | 8 | 238 | 4.56 | 20,683 | 5,615 | 3.68 |
| 46 | WDC | wdc wd20purz-85gu6y0 | 2 | 350 | 4.33 | 10,323 | 2,794 | 3.69 |
| 47 | WDC | wdc wd6003ffbx-68mu3n0 | 6 | 1,782 | 4.45 | 149,405 | 40,328 | 3.70 |
| 48 | Toshiba | toshiba dt01aca200 | 2 | 480 | 4.51 | 20,597 | 5,208 | 3.95 |
| 49 | WDC | wdc wd101kfbx-68r56n0 | 10 | 864 | 4.47 | 118,927 | 29,566 | 4.02 |
| 50 | WDC | wdc wd121kryz-01w0rb0 | 12 | 540 | 4.62 | 77,793 | 19,137 | 4.07 |
| 51 | WDC | wdc wd10purz-85u8xy0 | 1 | 129 | 4.43 | 6,717 | 1,640 | 4.10 |
| 52 | Seagate | st6000nm0115-1yz110 | 6 | 888 | 4.47 | 94,069 | 22,845 | 4.12 |
| 53 | Seagate | st2000ne0025-2fl101 | 2 | 503 | 4.50 | 23,567 | 5,666 | 4.16 |
| 54 | HGST | hgst hdn724040ale640 | 4 | 224 | 4.54 | 17,453 | 4,087 | 4.27 |
| 55 | WDC | wdc wd80emaz-00wjta0 | 8 | 496 | 4.42 | 49,521 | 11,579 | 4.28 |
| 56 | WDC | wdc wd4002fyyz-01b7cb1 | 4 | 1,189 | 4.59 | 147,174 | 34,179 | 4.31 |
| 57 | WDC | wdc wd20efrx-68euzn0 | 2 | 12,566 | 4.48 | 679,418 | 157,156 | 4.32 |
| 58 | WDC | wdc wd80efax-68lhpn0 | 8 | 935 | 4.37 | 103,075 | 23,770 | 4.34 |
| 59 | Seagate | st6000vn0033-2ee110 | 6 | 3,219 | 4.44 | 321,212 | 69,871 | 4.60 |
| 60 | HGST | hgst hus726t6tale6l4 | 6 | 322 | 4.20 | 29,188 | 6,010 | 4.86 |
| 61 | Seagate | st10000vn0004-2gs11l | 10 | 664 | 4.65 | 119,913 | 24,373 | 4.92 |
| 62 | HGST | hgst huh728080ale600 | 8 | 198 | 4.54 | 41,608 | 8,323 | 5.00 |
| 63 | WDC | wdc wd6002fryz-01wd5b1 | 6 | 690 | 4.62 | 76,806 | 14,993 | 5.12 |
| 64 | WDC | wdc wd8001ffwx-68j1un0 | 8 | 547 | 4.67 | 52,269 | 10,147 | 5.15 |
| 65 | HGST | hgst hdn726040ale614 | 4 | 1,016 | 4.63 | 92,640 | 17,821 | 5.20 |
| 66 | HGST | hgst hus726040ale610 | 4 | 130 | 4.59 | 13,211 | 2,495 | 5.30 |
| 67 | Seagate | st12000nm0007-2a1101 | 12 | 652 | 4.37 | 177,372 | 31,684 | 5.60 |
| 68 | HGST | hgst hdn726060ale614 | 6 | 522 | 4.61 | 96,880 | 16,819 | 5.76 |
| 69 | HGST | hgst hus726t4tale6l4 | 4 | 209 | 4.26 | 19,024 | 3,185 | 5.97 |
| 70 | Toshiba | toshiba dt01aca300 | 3 | 403 | 4.51 | 27,279 | 4,414 | 6.18 |
| 71 | Seagate | st8000vn0022-2el112 | 8 | 5,905 | 4.46 | 1,087,817 | 175,748 | 6.19 |
| 72 | WDC | wdc wd80efax-68knbn0 | 8 | 2,216 | 4.35 | 372,916 | 58,534 | 6.37 |
| 73 | WDC | wdc wd30efrx-68euzn0 | 3 | 6,522 | 4.49 | 584,590 | 88,570 | 6.60 |
| 74 | Seagate | st10000nm0016-1tt101 | 10 | 564 | 4.44 | 415,908 | 61,361 | 6.78 |
| 75 | WDC | wdc wd4002ffwx-68tz4n0 | 4 | 583 | 4.64 | 74,497 | 10,874 | 6.85 |
| 76 | Seagate | st4000ne0025-2ew107 | 4 | 1,728 | 4.48 | 204,073 | 25,800 | 7.91 |
| 77 | WDC | wdc wd10efrx-68fytn0 | 1 | 3,955 | 4.48 | 207,517 | 26,079 | 7.96 |
| 78 | WDC | wdc wd80ezaz-11tdba0 | 8 | 212 | 4.43 | 31,955 | 3,926 | 8.14 |
| 79 | Seagate | st6000ne0023-2ex110 | 6 | 594 | 4.41 | 114,862 | 14,059 | 8.17 |
| 80 | Seagate | st6000ne0021-2en11c | 6 | 247 | 4.55 | 35,414 | 4,210 | 8.41 |
| 81 | Seagate | st6000vx0023-2ef110 | 6 | 370 | 4.45 | 45,241 | 5,375 | 8.42 |
| 82 | Toshiba | toshiba hdwd120 | 2 | 372 | 4.47 | 32,482 | 3,713 | 8.75 |
| 83 | Toshiba | toshiba hdwd130 | 3 | 381 | 4.48 | 71,764 | 8,116 | 8.84 |
| 84 | Seagate | st3000dm007-1wy10g | 3 | 213 | 4.45 | 17,971 | 2,008 | 8.95 |
| 85 | WDC | wdc wd4001ffsx-68jnun0 | 4 | 222 | 4.47 | 20,459 | 2,191 | 9.34 |
| 86 | HGST | hgst hdn728080ale604 | 8 | 357 | 4.58 | 95,941 | 10,096 | 9.50 |
| 87 | Seagate | st8000nm0055-1rm112 | 8 | 893 | 4.45 | 159,218 | 16,552 | 9.62 |
| 88 | WDC | wdc wd4002fyyz-01b7cb0 | 4 | 205 | 4.52 | 22,738 | 2,257 | 10.07 |
| 89 | Toshiba | toshiba hdwd110 | 1 | 145 | 4.42 | 10,423 | 1,015 | 10.27 |
| 90 | WDC | wdc wd80efzx-68uw8n0 | 8 | 1,834 | 4.66 | 504,213 | 47,628 | 10.59 |
| 91 | Hitachi | hitachi hus724030ale641 | 3 | 221 | 4.46 | 24,645 | 2,300 | 10.72 |
| 92 | Toshiba | toshiba hdwn160 | 6 | 329 | 4.44 | 276,990 | 25,538 | 10.85 |
| 93 | Seagate | st12000vn0007-2gs116 | 12 | 1,097 | 4.46 | 434,199 | 39,696 | 10.94 |
| 94 | Seagate | st10000nm0086-2aa101 | 10 | 660 | 4.43 | 217,160 | 19,481 | 11.15 |
| 95 | Toshiba | toshiba mg05aca800e | 8 | 234 | 4.38 | 83,658 | 7,396 | 11.31 |
| 96 | WDC | wdc wd3001ffsx-68jnun0 | 3 | 149 | 4.47 | 11,268 | 894 | 12.61 |
| 97 | HGST | hgst hdn724030ale640 | 3 | 100 | 4.57 | 13,236 | 1,043 | 12.69 |
| 98 | Toshiba | toshiba dt01aca100 | 1 | 217 | 4.42 | 15,176 | 1,148 | 13.22 |
| 99 | Seagate | st4000nm0035-1v4107 | 4 | 1,018 | 4.48 | 325,120 | 23,182 | 14.02 |
| 100 | Seagate | st2000nm0008-2f3100 | 2 | 428 | 4.53 | 68,901 | 4,736 | 14.55 |
| 101 | WDC | wdc wd60efax-68shwn0 | 6 | 107 | 4.10 | 26,789 | 1,821 | 14.71 |
| 102 | Seagate | st6000dm003-2cy186 | 6 | 286 | 4.44 | 83,494 | 5,115 | 16.32 |
| 103 | Seagate | st1000nm0008-2f2100 | 1 | 157 | 4.47 | 25,466 | 1,521 | 16.74 |
| 104 | Toshiba | toshiba mg04aca600e | 6 | 258 | 4.51 | 109,339 | 6,446 | 16.96 |
| 105 | Seagate | st8000dm004-2cx188 | 8 | 604 | 4.43 | 193,465 | 11,343 | 17.06 |
| 106 | Seagate | st14000ne0008-2jk101 | 14 | 147 | 4.18 | 94,773 | 5,348 | 17.72 |
| 107 | Seagate | st4000vx007-2dt166 | 4 | 646 | 4.51 | 196,320 | 11,039 | 17.78 |
| 108 | Seagate | st4000dm005-2dp166 | 4 | 145 | 4.53 | 29,782 | 1,515 | 19.65 |
| 109 | Toshiba | toshiba hdwe160 | 6 | 124 | 4.55 | 64,841 | 3,210 | 20.20 |
| 110 | Toshiba | toshiba md04aca400 | 4 | 197 | 4.51 | 144,748 | 7,078 | 20.45 |
| 111 | Seagate | st2000dm008-2fr102 | 2 | 291 | 4.25 | 69,211 | 2,685 | 25.77 |
| 112 | Seagate | st4000vn008-2dr166 | 4 | 11,654 | 4.47 | 4,681,489 | 174,051 | 26.90 |
| 113 | Seagate | st4000dm004-2cv104 | 4 | 1,263 | 4.44 | 347,954 | 11,904 | 29.23 |
| 114 | Toshiba | toshiba mg04aca400n | 4 | 281 | 4.44 | 62,260 | 2,011 | 30.96 |
| 115 | Seagate | st8000as0002-1na17z | 8 | 165 | 4.49 | 89,239 | 2,685 | 33.23 |
| 116 | Toshiba | toshiba hdwq140 | 4 | 786 | 4.45 | 483,543 | 11,776 | 41.06 |
| 117 | Seagate | st6000nm0024-1ht17z | 6 | 143 | 4.55 | 76,186 | 1,620 | 47.04 |
| 118 | Toshiba | toshiba mg04aca200e | 2 | 129 | 4.41 | 78,111 | 1,021 | 76.49 |
| 119 | Toshiba | toshiba mg04aca400e | 4 | 281 | 4.38 | 382,158 | 3,392 | 112.66 |
| 120 | Toshiba | toshiba hdwe140 | 4 | 153 | 4.43 | 149,924 | 1,258 | 119.21 |
NOTES:
1. Cap TB refers to capacity in Terabytes for a given drive model
2. Avg POY refers to average power-on years for a given drive model
3. Total long latency read count is the sum of long latency reads for a given drive model
4. Total number of read commands is the sum of read commands for a given drive model
5. Long latency read ratio = total long latency read count / total number of read commands * 1,000,000
6. Drive models with outlier long latency read ratios are highlighted in bold
The drive models with low rank numbers (e.g., rank 1-10) have low long latency read ratios (i.e., only a few read commands result in long latency reads) and are generally expected to lag infrequently on reads. The drive models with high rank numbers (e.g., 111-120) have high long latency read ratios and are expected to lag more frequently on reads than drive models with low rank numbers. The drive models with the 10 highest (worst) rank numbers had exceptionally large long latency read ratios (1.5 IQR above Q3).
Neither the average power-on years, total number of read commands, nor capacity TB were significantly correlated (p > 0.05) with long latency read ratio. This means that these variables’ confounding effects on the drive model rankings were minimal.
Limitations
Before we conclude, we will acknowledge some limitations of the above ranking. First, we could not control for file size per command, which is a user-specific factor that may have influenced the drive ranking results, as we did not have the data to control for such a potential confound. Second, the drive rankings were based on drives with power-on years equivalent to 4-5 years, so we cannot generalize the rankings to drives older or younger than this.
Summary
To recap, we compared several drive models and ranked them according to their long latency reads, normalized by the number of read commands issued to them. The rankings may offer some insight into how much lag may be felt by users when using certain drive models. The rankings may also be an indicator of potential drive model longevity, although we cannot say that long latency reads are by themselves an indicator of drive failure. Limitations were discussed.