Categories

Blog posts about QNAP's products and technologies.
1. Computer storage drives have a limited lifespan.
Computer storage drives, both HDDs and SSDs, have a limited lifespan. HDDs can develop problems with their disk surface when the read/write heads crash into their disks due to shock, or when dust particulates scratch the surface of the disks after being batted around by the fast-rotating actuator arm. HDDs may also develop problems with their moving mechanical components, like their spindle motors, when drives overheat or their mechanical components wear down. SSDs are susceptible to problems resulting from degraded flash memory cells -which each have a limited number of writes before they can no longer be written to. Both kinds of drives utilize controllers that manage communication with the host, as well as intricate circuitry. These are susceptible to breakage when power surges occur.
The data shows that drives do indeed fail over time. Recent data from Backblaze [1] showed that drives from datacenters where drives are typically kept in air conditioned rooms can fail at an annual rate of 1.47%. Likewise, an analysis by ULINK found that drives from QNAP NAS units failed (i.e., were removed from their NAS while their RAID deteriorated) at a rate of 1.49% in 2023. And a study by Meta [2] showed that the three drive models examined increased in failure rates as the drives aged.
2. DA Drive Analyzer is a tool that you can use to anticipate when a drive is nearing the end of its life.
To deal with the reality of drive degradation and failure, both in controlled lab-like enviroments as well as home environments, ULINK Technology has developed a tool to predict drive failures, and more broadly, to monitor drive health metrics for signs of problems. This commercially available tool is called DA Drive Analyzer and it works with over 99% of commercial drives. DA Drive Analyzer has features to help both everyday users and advanced users keep track of their drives’ health.
3. Recommended way to use DA Drive Analyzer if you are an everyday user.
Everyday users will benefit most by monitoring DA Drive Analyzer’s main machine-learning-based (ML-based) Drive Health Predictions. This feature simply labels each drive’s health status as either healthy, moderate risk, or severe risk. By showing users the status of each drive, uncomplicated by additional details, users can decide in a simple way, whether a drive is at risk of failure in the near future or not. The status is generated using ULINK’s main machine learning algorithm. A Healthy (or Normal) status drive is unlikely to fail in the near-future. A Moderate-Risk (or Warning) status drive has a 70% chance of failing over the next 6 months. And a Severe-Risk (or Critical) status drive has a 90% chance of failing over the next 6 months.
A. NAS App
If you are a NAS user, the quickest way to see the main ML-based Drive Health Predictions is by opening up a DA Drive Analyzer NAS App, such as the DA Drive Analyzer App for QNAP NAS.
Installation
For detailed instructions on how to set up and license DA Drive Analyzer on a QNAP NAS, see https://www.qnap.com/en-us/how-to/tutorial/article/how-to-set-up-ulink-da-drive-analyzer-on-your-qnap-nas. For detailed instructions on how to set up and license DA Drive Analyzer on other supported NAS devices, see our Help Center at https://ulinktechda.zendesk.com/hc/en-us.
Open the Overview Page.
Once you’ve finished setting up the app and its licenses, please wait 24 hours for predictions to be generated. You can typically find the color-coded ML-based Drive Health Predictions on the main page of the app.
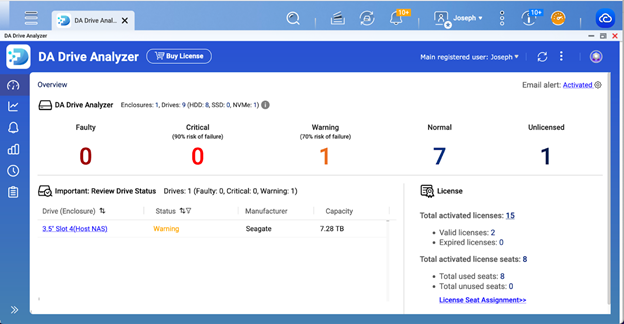
In the example above, we can see that a single drive in our NAS has been predicted as Warning (At-Moderate-Risk). This lets us know that the drive may be at risk of failing in the near future. We can also see the offending drive’s serial number, and that it is in slot 4 of our NAS.
With this information in hand, we have identified vulnerable drives and are in a better position to protect our data from loss.
4. Recommended way to use DA Drive Analyzer if you are an advanced user.
A. DA Portal
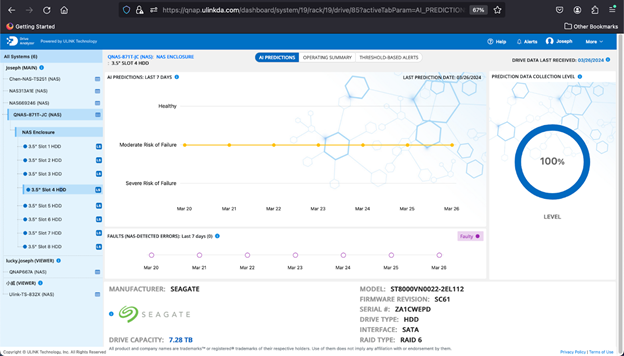
Advanced users may wish to go beyond the basic drive health predictions, and explore features such the Symptom Radar Chart, Threshold Alerts, and Fault Alerts. They can do so from within our online Dashboard, DA Portal (accessible from the menu of DA Drive Analyzer’s homepage at https://ulink-da.com).
Symptom Radar Chart
The Symptom Radar Chart is an ML-based feature within DA Portal that allows users to see which of five health metric groups are showing signs of deterioration. This allows you to quickly narrow down which symptoms may be causing drive deterioration -something the main ML-Based Drive Health Prediction mechanism cannot do at this time. You can also think of the Symptom Radar Chart as an additional drive failure prediction mechanism where the lowest symptom score among any of the symptom groups represents the decile survival rate over the next year.
To see this feature, log in to DA Portal.
Navigate to a specific drive using the left navigation bar.
Go to the THRESHOLD-BASED ALERTS tab and expand the SYMPTOM RADAR CHART.
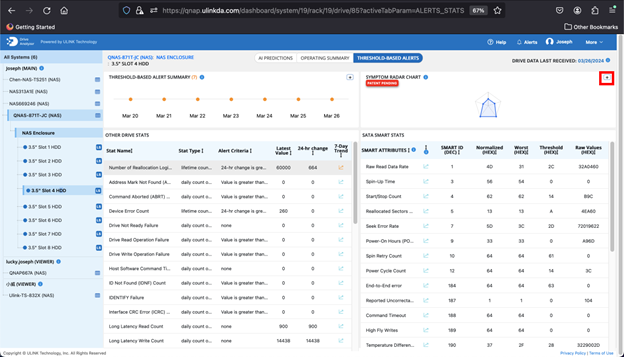
Here, we see a drive with 3 out of 5 symptom groups experiencing deterioration (anything less than a score of 10 is deterioration). The lowest score is found with the SMART symptom group, which has a score of 4. This means that this drive has an approximately 40% chance of being usable a year from now.
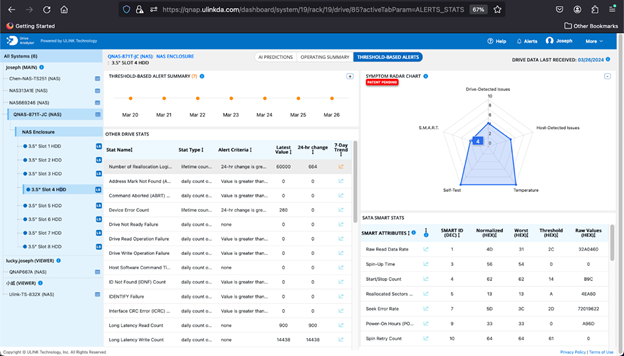
Clicking on a symptom group highlights health metrics related to that group, as we can see by clicking on the Drive-Detected Issues group below. A quick glance tells us that within the Drive-Detected Issues group, several health metrics are showing elevated values, such as the number of reallocated logical sectors, device error count, and ASR events.
Each of the elevated symptoms potentially tells us something about the problems that this drive is experiencing. For example, the elevated number of high priority unload events (5th symptom from the top) tells us that the drive may have experienced shock or power supply issues in the past that warranted emergency retraction of the read/write head.
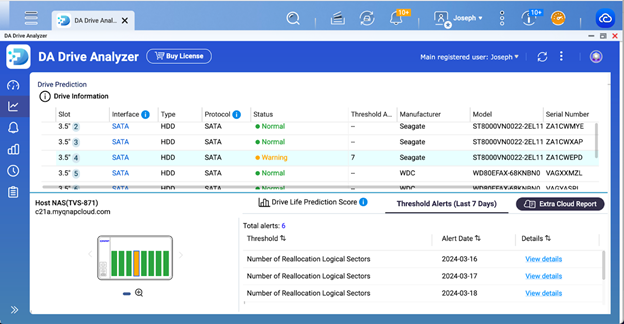
Threshold Alerts
Threshold Alerts are a feature of DA Drive Analyzer that is similar to the Symptom Radar Chart in that it can help you to pinpoint the cause of drive problems. Unlike the Symptom Radar Chart, it does not rely on ML. Instead, it is an alert system that is triggered whenever certain symptoms that ULINK has determined to be important surpass a predefined threshold.
The easiest way to see Threshold Alerts in DA Portal is by clicking on Alerts in DA Portal.
Then selecting Threshold-Based Alerts on the filter, and hitting Submit.
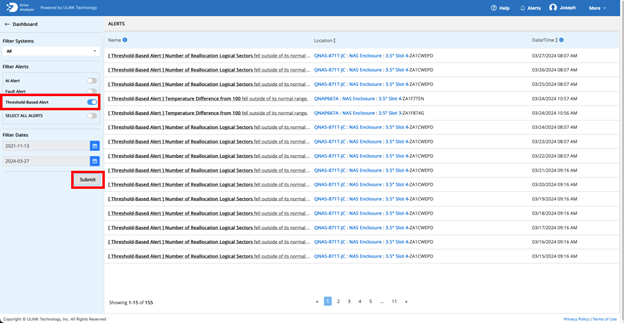
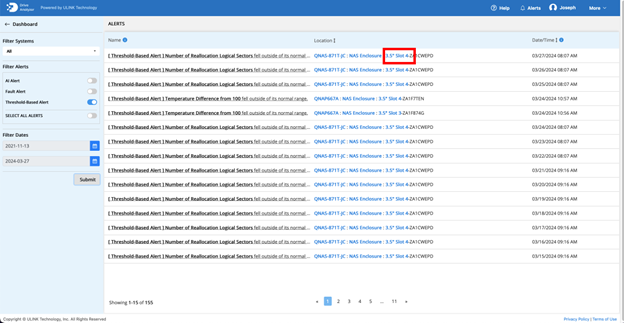
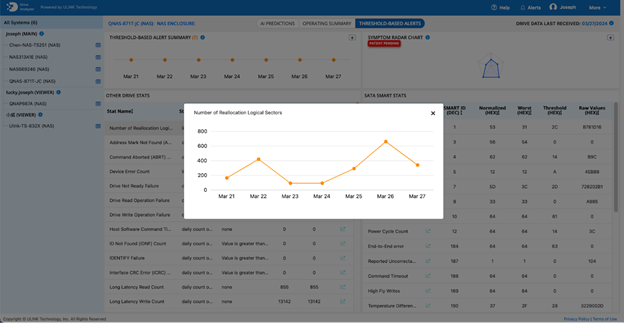
Threshold Alerts will show on the table to the right. Click on the Slot of any Threshold Alert to go to the drive that generated the Threshold Alert.
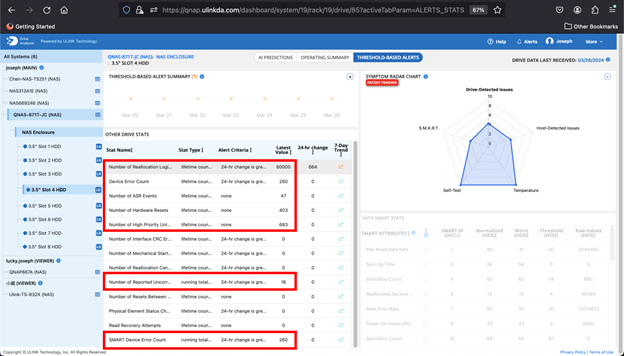
Once you are at the drive level, click on the Threshold-Based Alerts tab. Recent dates where threshold alerts have occurred will be shown on the top left as orange dots.
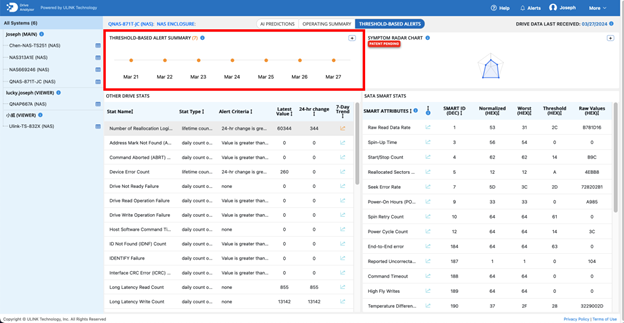
Individual threshold alerts will be indicated on the bottom left or bottom right with an orange trend symbol.
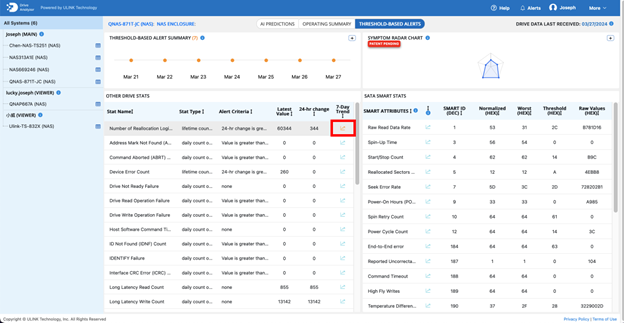
In the example drive above, the health metric, number of reallocated logical sectors, changed in the last 24 hours, which triggered a Threshold Alert. If we look at this metric over the last 7 days by clicking on the trend symbol, we can see that this metric has recently been elevated, suggesting damage to the disk’s surface.
B. DA Monitor
There may be times when an advanced user, such as an IT manager, may need to monitor the health of drives for several people, each having one or more computer or NAS systems monitored by DA Drive Analyzer. The quickest way to do this is by using DA Monitor, which allows for quick and centralized drive monitoring.
DA Monitor is a desktop application that lets you add DA Drive Analyzer users, and then view the number of at-risk drives for each user at a glance. It runs on Windows and Mac.
You can download DA Monitor from https://ulink-da.com/da_monitor/.
Once you have installed the application, you can add your first account by clicking on Add Account. Follow the instructions and enter the account and account password of the user you are trying to add.
Additional user accounts can be added by clicking on the Add Account button, which looks like a user profile.
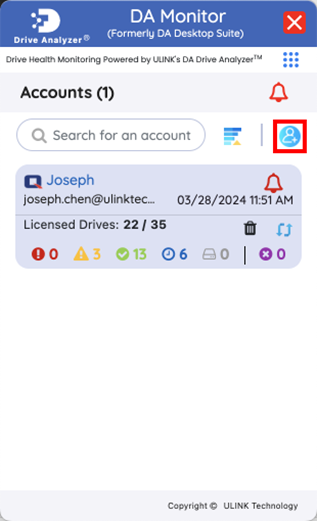
If a user has any drives predicted to fail soon by DA Drive Analyzer, you will see a non-zero number next to the red (Severe Risk) or yellow (Moderate Risk) icons. In the example above, we see a “3” next to the yellow Moderate Risk icon, which tells us that the user, Joseph, has 3 drives that have been predicted to fail soon.
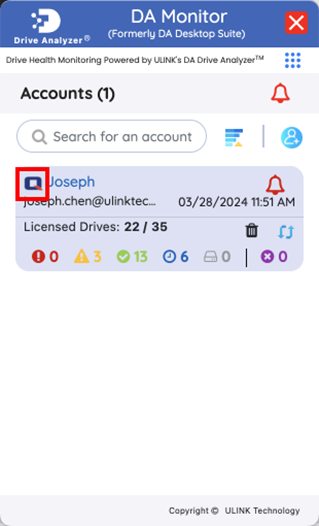
We can check the location of these 3 drives in DA Portal by clicking on the logo on the top left corner of the user’s card, which will take us to DA Portal.
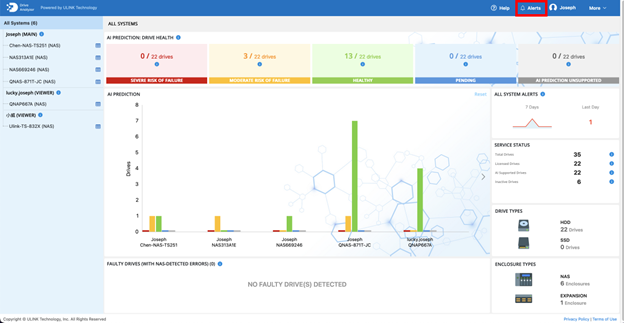
Once we are in DA Portal, we can click on the yellow MODERATE RISK OF FAILURE (or the red SEVERE RISK OF FAILURE if DA Portal showed any red Severe Risk drives), which will take us to a table containing the three drives we saw in DA Monitor.
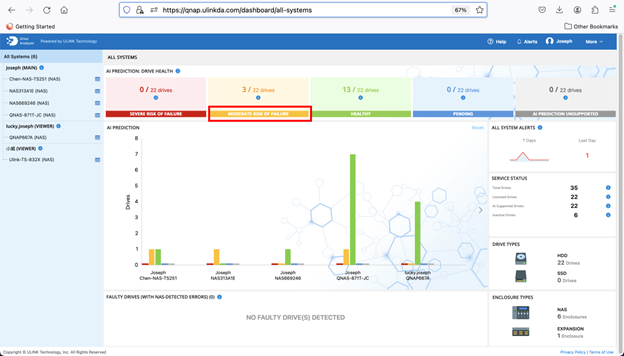
In this table, we can see the computer or NAS system, drive enclosure, and slot number of the three yellow Moderate-Risk drives, which let’s locate the physical drives.
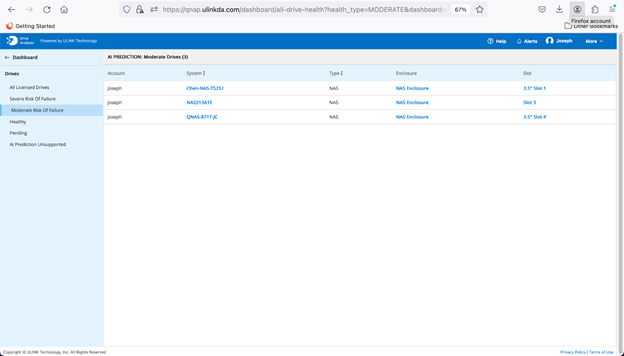
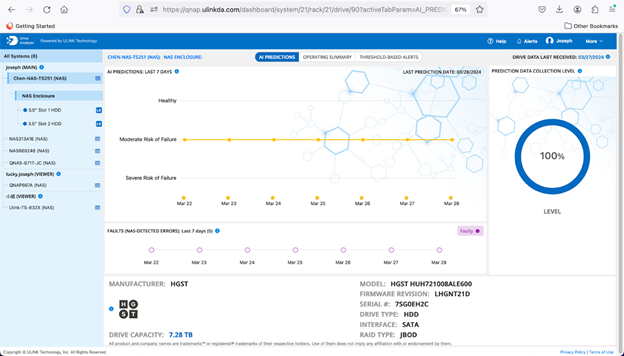
Clicking on the slot number of any of these drives will take us to that drive’s page, where we can see recent health trends for that drive, as well as its serial number.
5. What to do when a drive is at risk
What should you do if you see a drive that has been predicted Moderate Risk or Severe Risk by DA Drive Analyzer? Our recommendation is to either back up that drive immediately and frequently going forward, or to replace it to protect your data. Two levels of risk, Severe and Moderate, are provided by DA Drive Analyzer so that the user can better weigh how to act based on their risk tolerance, budget, and SLAs in the case of businesses.
Once at-risk drives have been identified, advanced users can additionally explore the cause of drive deterioration with the Symptom Radar Chart, or Threshold Alerts. Perhaps the temperature of the drive enclosures are excessive. Or perhaps a loose cable is causing problems. With these features, DA Analyzer can help you to pinpoint possible causes of drive failures.
References
1. https://www.backblaze.com/blog/backblaze-drive-stats-for-q3-2023/
2. Miller, Z., Medaiyese, O., Ravi, M., Beatty, A., & Lin, F. (2023, June). Hard Disk Drive Failure Analysis and Prediction: An Industry View. In 2023 53rd Annual IEEE/IFIP International Conference on Dependable Systems and Networks-Supplemental Volume (DSN-S) (pp. 21-27). IEEE.